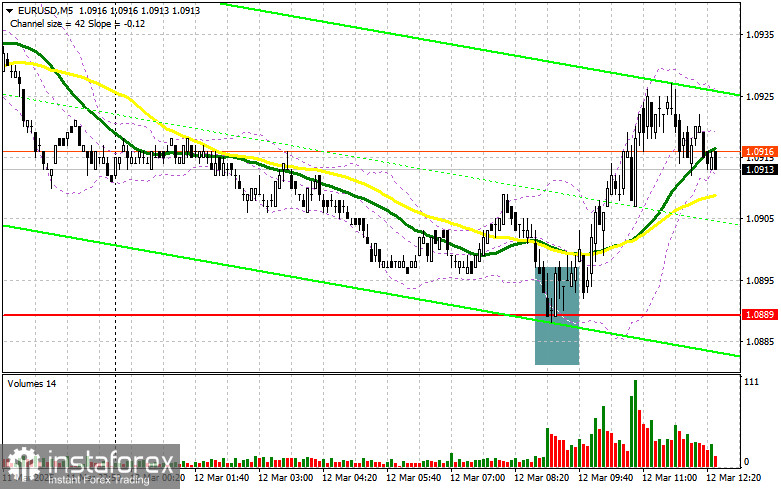
In my morning forecast, I focused on the 1.0889 level and planned to make trading decisions based on it. Looking at the 5-minute chart, we can analyze what happened. The decline and formation of a false breakout around 1.0889 created an excellent entry point for long positions, resulting in the pair rising by more than 30 points. The technical outlook for the second half of the day remains unchanged.
For opening long positions on EUR/USD:
In the absence of significant economic data, euro buyers found support around 1.0889, but the pair has yet to experience a more active rally or update its monthly high. In the second half of the day, two important US inflation reports will be released: the Consumer Price Index (CPI) and the Core CPI (excluding food and energy prices). A rise in inflation for February will help the Fed determine its future stance, strengthening the US dollar. A decrease in inflation will allow the Fed to take a more dovish approach.
If the euro declines, only a false breakout around 1.0889, similar to the one analyzed above, will provide a reason for new EUR/USD purchases, aiming for further bullish market development and a potential test of 1.0945, a new local high. A break and retest of this range will confirm a correct entry point for long positions, with an extension toward 1.0979. The farthest target is 1.1011, where I will lock in profits.
If EUR/USD declines and shows no activity around 1.0889, a significant correction could begin. In this case, sellers could push the pair down to 1.0838. Only after forming a false breakout there will I consider buying the euro. I plan to open long positions on a direct rebound from 1.0807, targeting an upward correction of 30-35 points intraday.
For opening short positions on EUR/USD:
Sellers are betting on US inflation, as nothing else is currently working in their favor. If the pair continues rising after the inflation data release, only a false breakout around 1.0945 will provide an entry point for short positions, aiming for a correction toward the 1.0889 support level. A break and consolidation below this range will serve as another sell opportunity, pushing the pair toward 1.0838. The farthest target will be 1.0807, where I will lock in profits.
If EUR/USD rises in the second half of the day and bears show no significant activity around 1.0945, buyers may drive the pair even higher. In this scenario, I will postpone short positions until the next resistance at 1.0979. There, I will sell but only after an unsuccessful consolidation attempt. I plan to open short positions on a direct rebound from 1.1011, targeting a downward correction of 30-35 points.
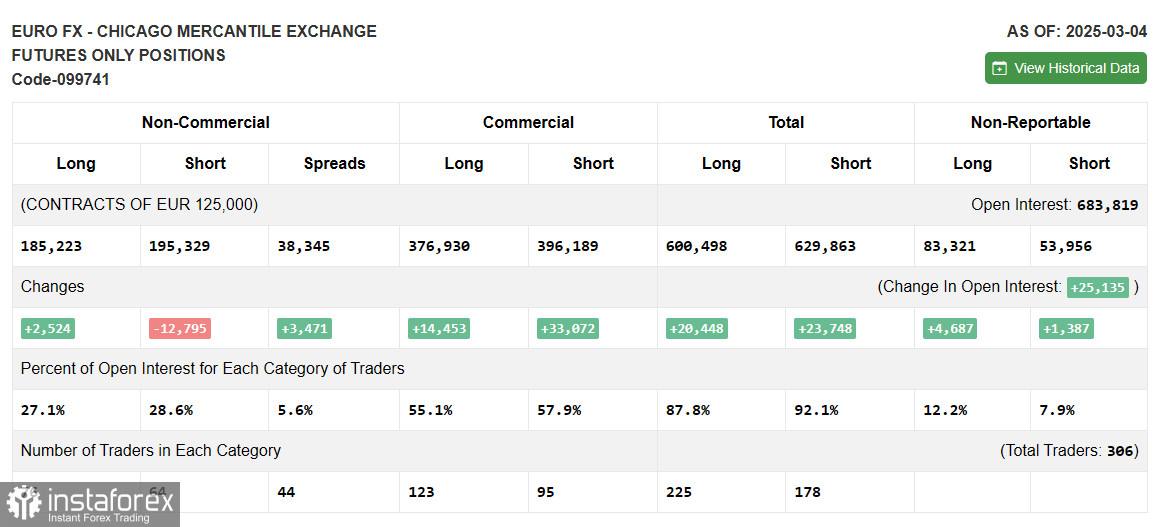
The Commitment of Traders (COT) report for March 4 showed a rise in long positions and a significant reduction in short positions. More and more traders are willing to buy the euro. Germany's new fiscal policy to stimulate the economy has increased euro demand, leading to significant strengthening against the US dollar. The European Central Bank's cautious stance on rate cuts has also supported demand for EUR/USD, as reflected in the COT report.
The previously dominant short positioning no longer has the same impact as before, but traders should be cautious about buying at current highs. According to the COT report, long non-commercial positions increased by 2,524 to 185,223, while short non-commercial positions decreased by 12,795 to 195,329. As a result, the gap between long and short positions widened by 3,471.
Indicator Signals:
Moving Averages:
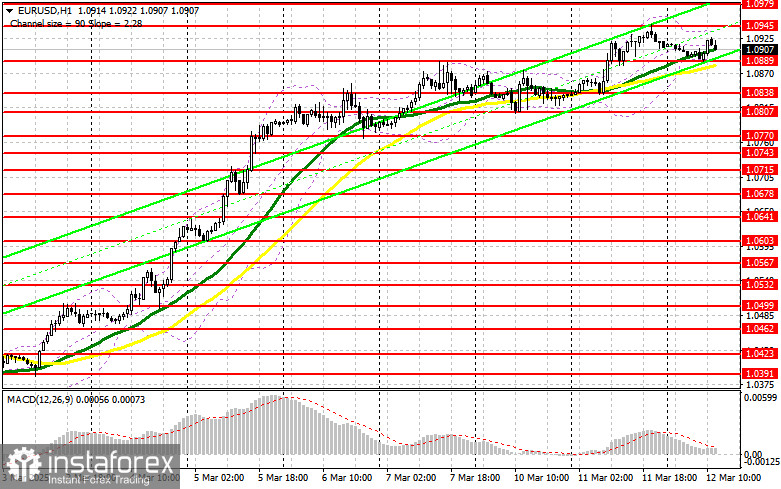
Trading is taking place around the 30-day and 50-day moving averages, indicating market uncertainty.
Note: The moving averages discussed are based on the H1 chart, differing from the standard daily moving averages (D1 chart).
Bollinger Bands:
If the price declines, the lower boundary of the Bollinger Bands at 1.0889 will act as support.
Indicator Descriptions:
- Moving Average (MA): Defines the current trend by smoothing volatility and noise. 50-period MA (yellow line), 30-period MA (green line).
- MACD (Moving Average Convergence/Divergence): Measures momentum shifts. Fast EMA – 12-period, Slow EMA – 26-period, SMA – 9-period.
- Bollinger Bands: A volatility indicator with a 20-period setting.
- Non-commercial traders: Speculators such as individual traders, hedge funds, and institutions using the futures market for speculative purposes.
- Long non-commercial positions: The total open long positions held by speculative traders.
- Short non-commercial positions: The total open short positions held by speculative traders.
- Net non-commercial position: The difference between long and short positions held by speculative traders.