Actual patterns
Patterns are graphical models which are formed in the chart by the price. According to one of the technical analysis postulates, history (price movement) repeats itself. It means that the price movements are often similar in the same situations which makes it possible to predict the further development of the situation with a high probability.
Actual Patterns
- All
- Double Top
- Flag
- Head and Shoulders
- Pennant
- Rectangle
- Triangle
- Triple top
- All
- #AAPL
- #AMZN
- #Bitcoin
- #EBAY
- #FB
- #GOOG
- #INTC
- #KO
- #MA
- #MCD
- #MSFT
- #NTDOY
- #PEP
- #TSLA
- #TWTR
- AUDCAD
- AUDCHF
- AUDJPY
- AUDUSD
- EURCAD
- EURCHF
- EURGBP
- EURJPY
- EURNZD
- EURRUB
- EURUSD
- GBPAUD
- GBPCHF
- GBPJPY
- GBPUSD
- GOLD
- NZDCAD
- NZDCHF
- NZDJPY
- NZDUSD
- SILVER
- USDCAD
- USDCHF
- USDJPY
- USDRUB
- All
- M5
- M15
- M30
- H1
- D1
- All
- Buy
- Sale
- All
- 1
- 2
- 3
- 4
- 5
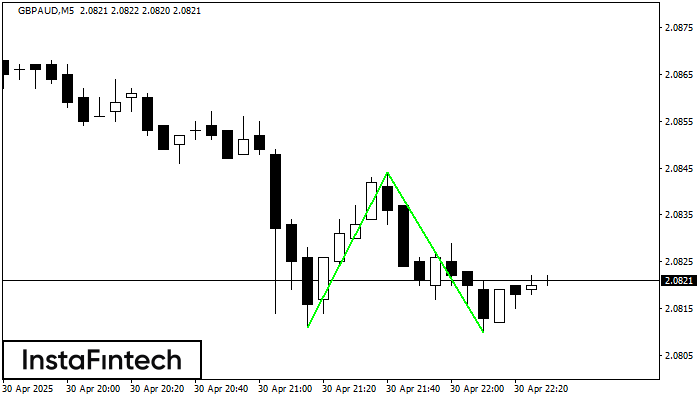
The Double Bottom pattern has been formed on GBPAUD M5; the upper boundary is 2.0844; the lower boundary is 2.0810. The width of the pattern is 33 points. In case
The M5 and M15 time frames may have more false entry points.
Open chart in a new window
According to the chart of H1, #TSLA formed the Bullish Rectangle. This type of a pattern indicates a trend continuation. It consists of two levels: resistance 294.59 and support 270.55
Open chart in a new window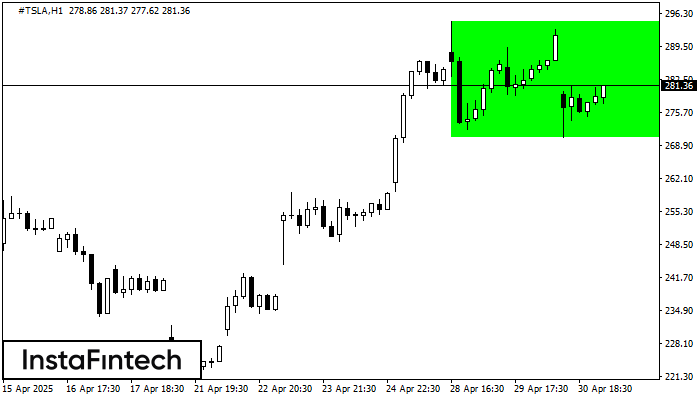
According to the chart of H1, #TSLA formed the Bullish Rectangle. The pattern indicates a trend continuation. The upper border is 294.59, the lower border is 270.55. The signal means
Open chart in a new window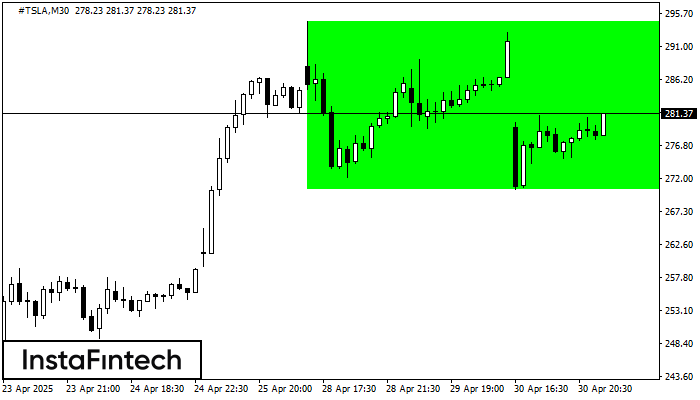
According to the chart of M30, #TSLA formed the Bullish Rectangle. This type of a pattern indicates a trend continuation. It consists of two levels: resistance 294.59 and support 270.55
Open chart in a new window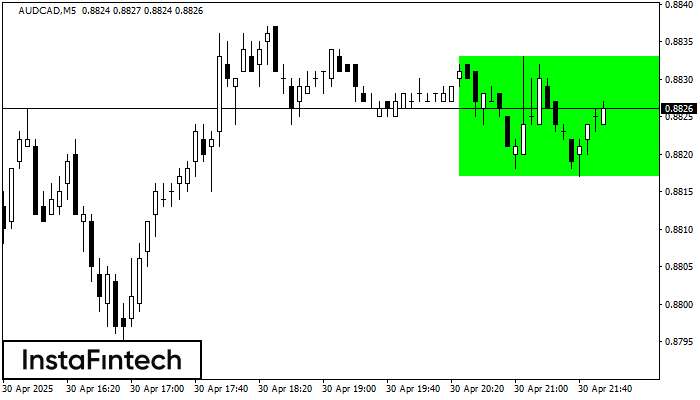
According to the chart of M5, AUDCAD formed the Bullish Rectangle. This type of a pattern indicates a trend continuation. It consists of two levels: resistance 0.8833 and support 0.8817
The M5 and M15 time frames may have more false entry points.
Open chart in a new window
On the chart of #PEP M15 the Double Top reversal pattern has been formed. Characteristics: the upper boundary 135.97; the lower boundary 133.07; the width of the pattern 290 points
The M5 and M15 time frames may have more false entry points.
Open chart in a new window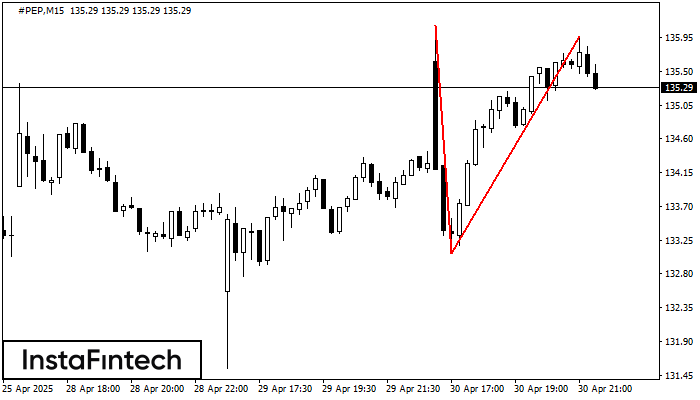
The Double Top reversal pattern has been formed on #PEP M15. Characteristics: the upper boundary 136.11; the lower boundary 133.07; the width of the pattern is 290 points. Sell trades
The M5 and M15 time frames may have more false entry points.
Open chart in a new window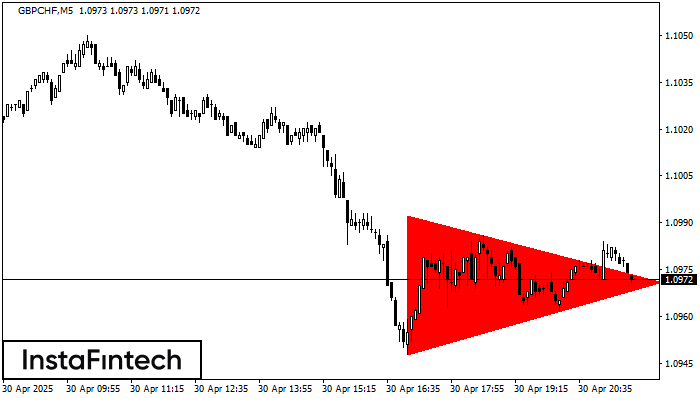
According to the chart of M5, GBPCHF formed the Bearish Symmetrical Triangle pattern. This pattern signals a further downward trend in case the lower border 1.0948 is breached. Here
The M5 and M15 time frames may have more false entry points.
Open chart in a new window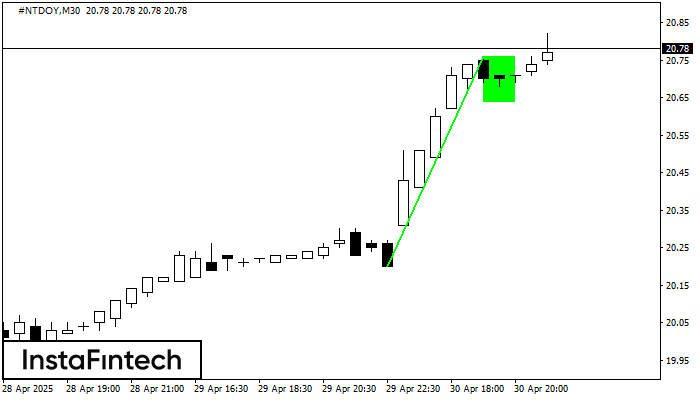
The Bullish Flag pattern has been formed on the chart #NTDOY M30 which signals that the upward trend will continue. Signals: а break of the peak at 20.76 may push
Open chart in a new window