MobileTrader
MobileTrader: trading platform near at hand!
Download and start right now!

 07.04.2025 03:01 PM
The oil and gas market has found itself at the epicenter of a new trade war, where economic interests and political ambitions are colliding head-on. Technical levels are breaking down under the weight of headlines, and the response from China and Europe could set the tone for weeks to come.
Without clear signals of de-escalation, price pressure is likely to persist. The market needs more than just numbers. It needs a new direction in political decision-making, which remains in short supply.
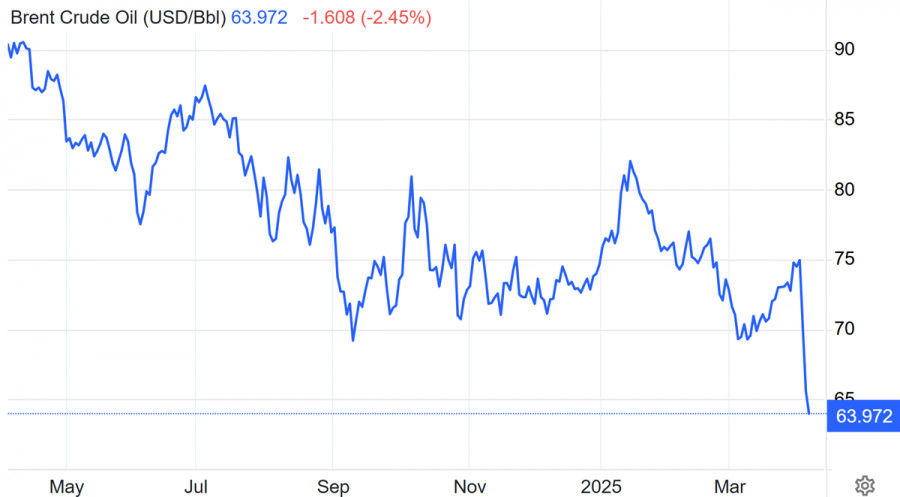
Brent crude prices are in sharp decline, falling more than 3.5% in a single session and showing the steepest drop since March 2023. Last week alone, prices tumbled 9.2%, reaching their lowest levels since April 2021.
The sell-off stems from the lack of progress in lifting US restrictions and an escalating geoeconomic conflict between the world's largest economies.
As the United States continues on its protectionist course, China has responded with 34% tariffs on a range of American goods, a clear signal of a new phase of trade escalation.
This has sharply heightened investor fears of a global recession, where oil and gas are deeply embedded in both consumer spending and industrial supply chains.
Europe, for its part, has not remained idle. The European Commission is set to propose a retaliatory tariff package today, mainly targeting US consumer goods. However, markets are watching closely to see whether the measures will affect energy imports or create new bottlenecks in the supply of vital resources.
Meanwhile, countries in Southeast Asia could fill the gaps left by disrupted trade routes, creating new competitive pressures in the oil and gas market and adding to price volatility.
Japan, according to Bloomberg, is reportedly seeking to soften the blow by negotiating a bilateral agreement with President Trump, adding yet another layer of uncertainty to the global outlook.
The uncertainty is further compounded by key macro events ahead: the upcoming EIA report on US crude inventories, oil market forecasts, and inflation data out of the United States and China.
These figures could either accelerate the sell-off or offer temporary relief, depending on the outcomes.
Technical outlook: Brent is on edge
Brent crude has broken through a key support zone at $64.50–65.00 and is now heading toward the next critical level at $60.80. On the daily chart, the breakdown occurred on elevated volume, confirming the strength of the downward momentum.
If geopolitical tensions do not intensify, Brent may trade within a $60–65 per barrel range over the coming weeks. Below $60 lies a historically active buyer zone but without fundamental catalysts, any rebound is likely to be short-lived.
Natural gas: downward pressure persists
Natural gas futures (NYMEX) remain in negative territory. After briefly touching the $3.70 level, prices pulled back toward local highs. However, a key ascending support line has been breached, signaling weakening bullish momentum.
The next critical level is $3.40, aligned with the 200-day moving average. A breakdown below this point could open the path to $3.20, which may become a new equilibrium level in light of industrial uncertainty and softening global demand.
MobileTrader: trading platform near at hand!
Download and start right now!
You have already liked this post today
*Disclaimer: The market analysis posted here is meant to increase your awareness, but not to give instructions to make a trade.
 If you have any content questions, please contact editorial-board@instaforex.com
The test of the 147.13 price level occurred just as the MACD indicator began moving upward from the zero line, confirming a valid entry point for buying the dollar
The test of the 1.2786 price level occurred when the MACD indicator had already moved significantly above the zero line, which limited the pair's upside potential. The second test
The first test of the 1.0913 price level occurred when the MACD indicator moved significantly below the zero line, limiting the pair's downside potential. For this reason
The price test at 146.93 occurred when the MACD indicator had already moved far above the zero line, which limited the pair's upward potential. The second test of 146.93 coincided
The price test of 1.2793 occurred when the MACD indicator moved significantly below the zero mark, limiting the pair's downside potential. A second test of 1.2793 while MACD
Your IP address shows that you are currently located in the USA. If you are a resident of the United States, you are prohibited from using the services of InstaFintech Group including online trading, online transfers, deposit/withdrawal of funds, etc.
If you think you are seeing this message by mistake and your location is not the US, kindly proceed to the website. Otherwise, you must leave the website in order to comply with government restrictions.
Why does your IP address show your location as the USA?
Please confirm whether you are a US resident or not by clicking the relevant button below. If you choose the wrong option, being a US resident, you will not be able to open an account with InstaForex anyway.
We are sorry for any inconvenience caused by this message.


