

Actual patterns
Patterns are graphical models which are formed in the chart by the price. According to one of the technical analysis postulates, history (price movement) repeats itself. It means that the price movements are often similar in the same situations which makes it possible to predict the further development of the situation with a high probability.
Actual Patterns
- All
- Double Top
- Flag
- Head and Shoulders
- Pennant
- Rectangle
- Triangle
- Triple top
- All
- #AAPL
- #AMZN
- #Bitcoin
- #EBAY
- #FB
- #GOOG
- #INTC
- #KO
- #MA
- #MCD
- #MSFT
- #NTDOY
- #PEP
- #TSLA
- #TWTR
- AUDCAD
- AUDCHF
- AUDJPY
- AUDUSD
- EURCAD
- EURCHF
- EURGBP
- EURJPY
- EURNZD
- EURRUB
- EURUSD
- GBPAUD
- GBPCHF
- GBPJPY
- GBPUSD
- GOLD
- NZDCAD
- NZDCHF
- NZDJPY
- NZDUSD
- SILVER
- USDCAD
- USDCHF
- USDJPY
- USDRUB
- All
- M5
- M15
- M30
- H1
- D1
- All
- Buy
- Sale
- All
- 1
- 2
- 3
- 4
- 5
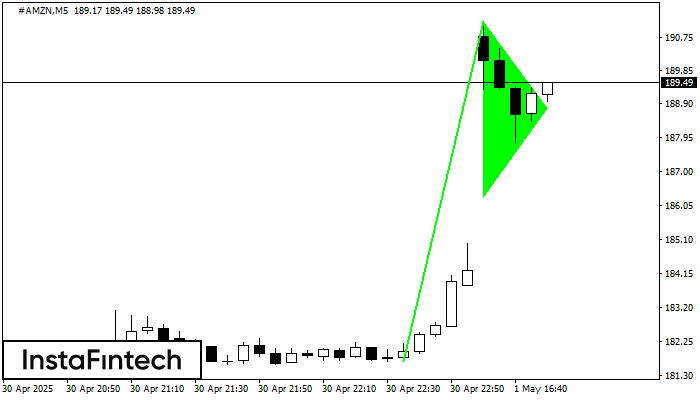
The Bullish pennant graphic pattern has formed on the #AMZN M5 instrument. This pattern type falls under the category of continuation patterns. In this case, if the quote can breaks
The M5 and M15 time frames may have more false entry points.
Open chart in a new window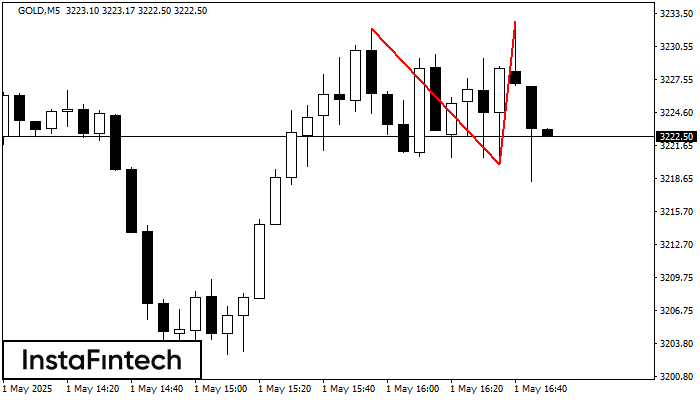
On the chart of GOLD M5 the Double Top reversal pattern has been formed. Characteristics: the upper boundary 3232.80; the lower boundary 3219.90; the width of the pattern 1290 points
The M5 and M15 time frames may have more false entry points.
Open chart in a new window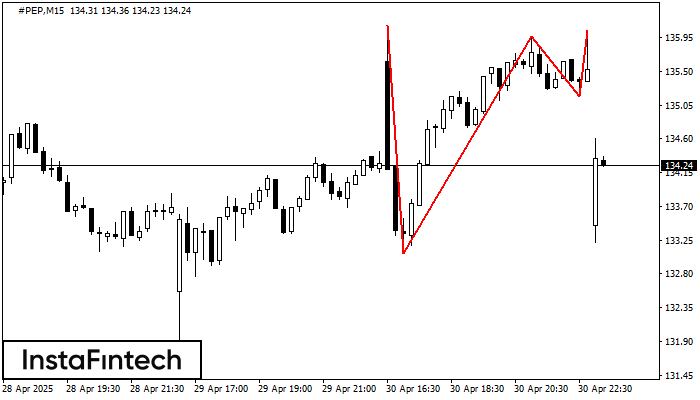
The Triple Top pattern has formed on the chart of the #PEP M15 trading instrument. It is a reversal pattern featuring the following characteristics: resistance level 6, support level -210
The M5 and M15 time frames may have more false entry points.
Open chart in a new window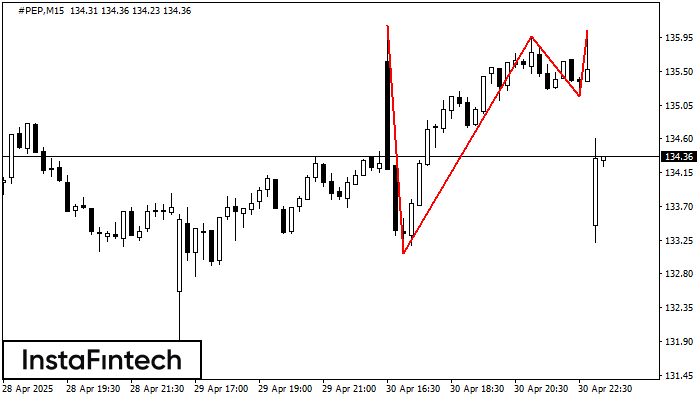
On the chart of the #PEP M15 trading instrument, the Triple Top pattern that signals a trend change has formed. It is possible that after formation of the third peak
The M5 and M15 time frames may have more false entry points.
Open chart in a new window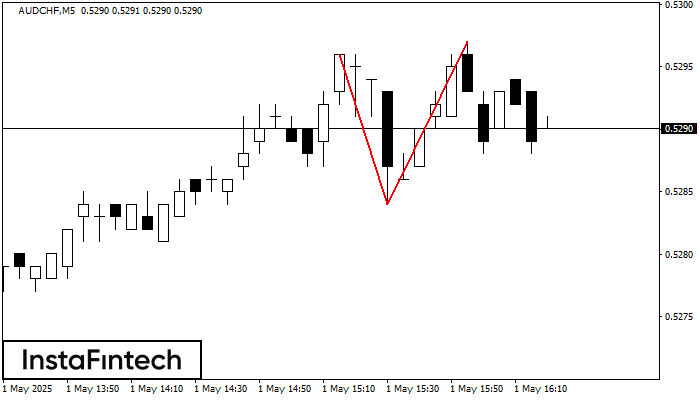
The Double Top pattern has been formed on AUDCHF M5. It signals that the trend has been changed from upwards to downwards. Probably, if the base of the pattern 0.5284
The M5 and M15 time frames may have more false entry points.
Open chart in a new window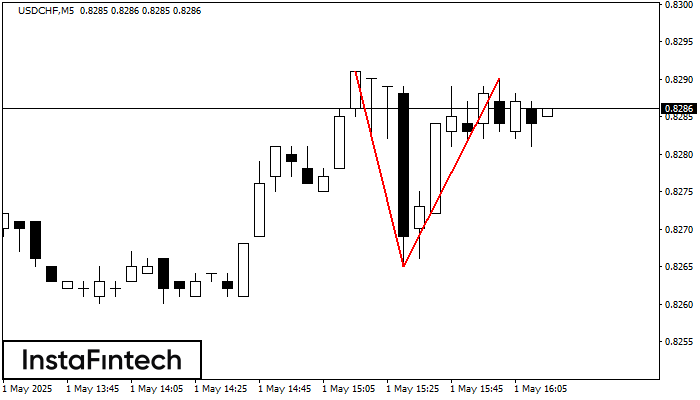
The Double Top reversal pattern has been formed on USDCHF M5. Characteristics: the upper boundary 0.8291; the lower boundary 0.8265; the width of the pattern is 25 points. Sell trades
The M5 and M15 time frames may have more false entry points.
Open chart in a new window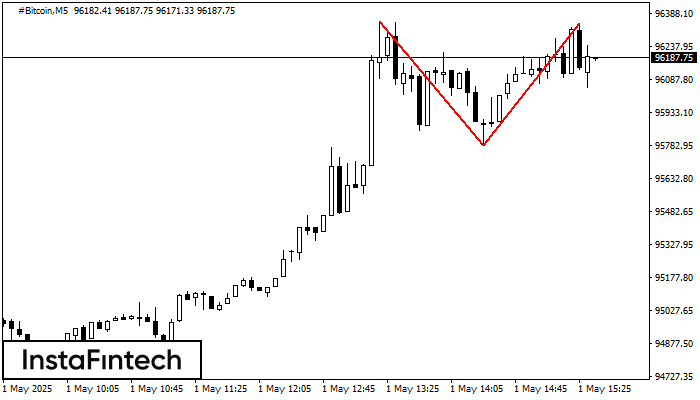
The Double Top reversal pattern has been formed on #Bitcoin M5. Characteristics: the upper boundary 96351.95; the lower boundary 95781.93; the width of the pattern is 56120 points. Sell trades
The M5 and M15 time frames may have more false entry points.
Open chart in a new window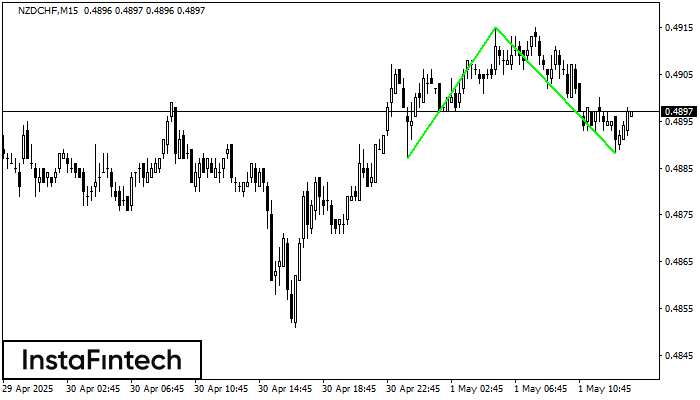
The Double Bottom pattern has been formed on NZDCHF M15. Characteristics: the support level 0.4887; the resistance level 0.4915; the width of the pattern 28 points. If the resistance level
The M5 and M15 time frames may have more false entry points.
Open chart in a new window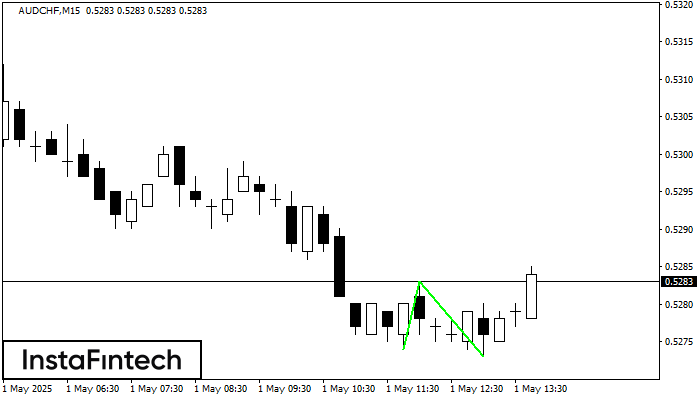
The Double Bottom pattern has been formed on AUDCHF M15; the upper boundary is 0.5283; the lower boundary is 0.5273. The width of the pattern is 9 points. In case
The M5 and M15 time frames may have more false entry points.
Open chart in a new window


