

Actual patterns
Patterns are graphical models which are formed in the chart by the price. According to one of the technical analysis postulates, history (price movement) repeats itself. It means that the price movements are often similar in the same situations which makes it possible to predict the further development of the situation with a high probability.
Actual Patterns
- All
- Double Top
- Flag
- Head and Shoulders
- Pennant
- Rectangle
- Triangle
- Triple top
- All
- #AAPL
- #AMZN
- #Bitcoin
- #EBAY
- #FB
- #GOOG
- #INTC
- #KO
- #MA
- #MCD
- #MSFT
- #NTDOY
- #PEP
- #TSLA
- #TWTR
- AUDCAD
- AUDCHF
- AUDJPY
- AUDUSD
- EURCAD
- EURCHF
- EURGBP
- EURJPY
- EURNZD
- EURRUB
- EURUSD
- GBPAUD
- GBPCHF
- GBPJPY
- GBPUSD
- GOLD
- NZDCAD
- NZDCHF
- NZDJPY
- NZDUSD
- SILVER
- USDCAD
- USDCHF
- USDJPY
- USDRUB
- All
- M5
- M15
- M30
- H1
- D1
- All
- Buy
- Sale
- All
- 1
- 2
- 3
- 4
- 5
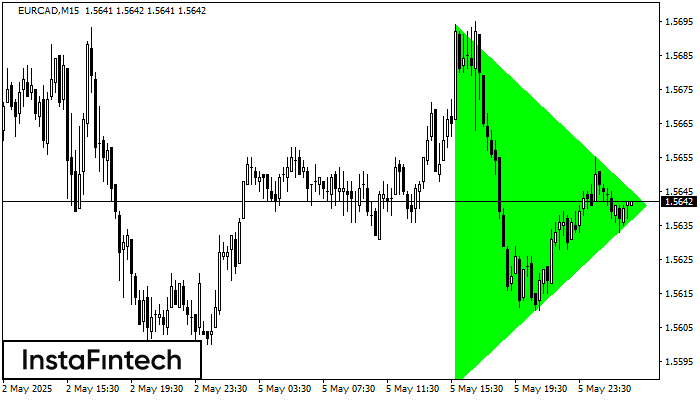
According to the chart of M15, EURCAD formed the Bullish Symmetrical Triangle pattern. The lower border of the pattern touches the coordinates 1.5588/1.5641 whereas the upper border goes across 1.5694/1.5641
The M5 and M15 time frames may have more false entry points.
Open chart in a new window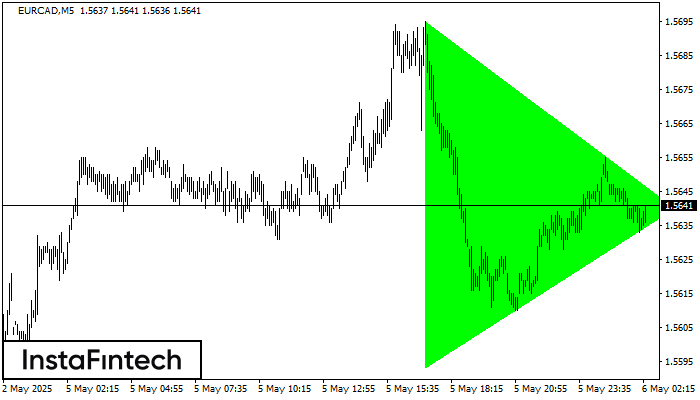
According to the chart of M5, EURCAD formed the Bullish Symmetrical Triangle pattern. The lower border of the pattern touches the coordinates 1.5593/1.5640 whereas the upper border goes across 1.5695/1.5640
The M5 and M15 time frames may have more false entry points.
Open chart in a new window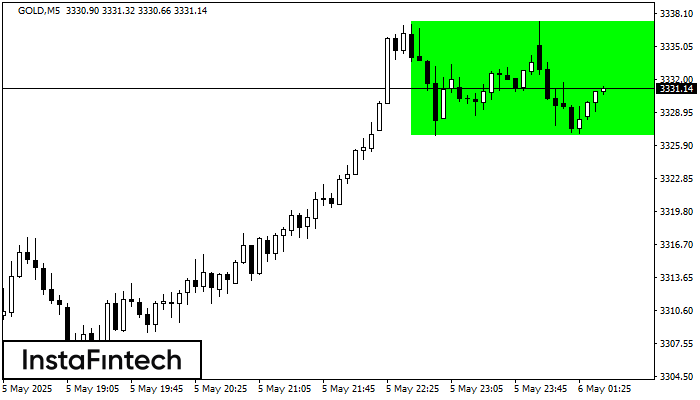
According to the chart of M5, GOLD formed the Bullish Rectangle. This type of a pattern indicates a trend continuation. It consists of two levels: resistance 3337.37 and support 3326.83
The M5 and M15 time frames may have more false entry points.
Open chart in a new window
The Triple Bottom pattern has formed on the chart of USDJPY M5. Features of the pattern: The lower line of the pattern has coordinates 143.80 with the upper limit 143.80/143.76
The M5 and M15 time frames may have more false entry points.
Open chart in a new window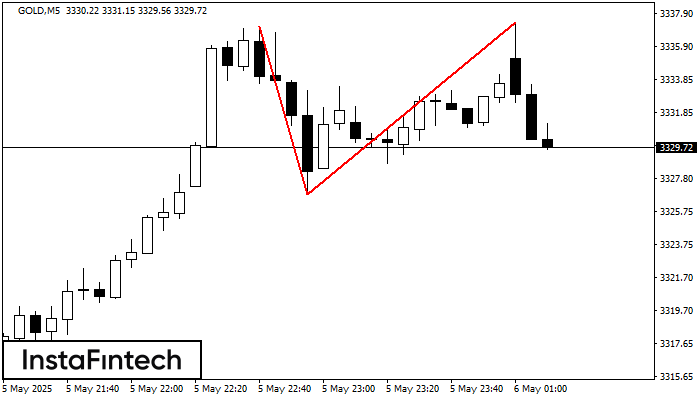
The Double Top pattern has been formed on GOLD M5. It signals that the trend has been changed from upwards to downwards. Probably, if the base of the pattern 3326.83
The M5 and M15 time frames may have more false entry points.
Open chart in a new window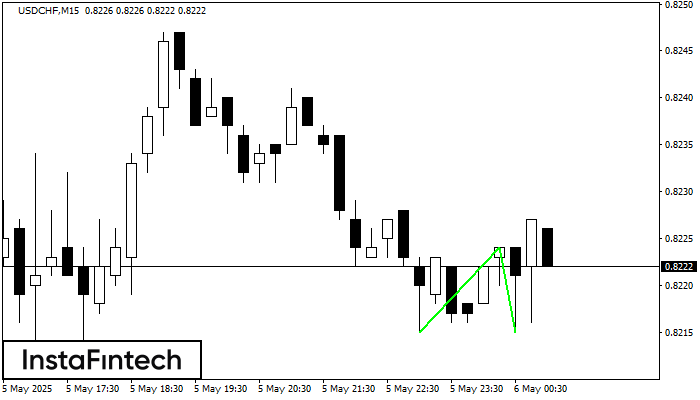
The Double Bottom pattern has been formed on USDCHF M15; the upper boundary is 0.8224; the lower boundary is 0.8215. The width of the pattern is 9 points. In case
The M5 and M15 time frames may have more false entry points.
Open chart in a new window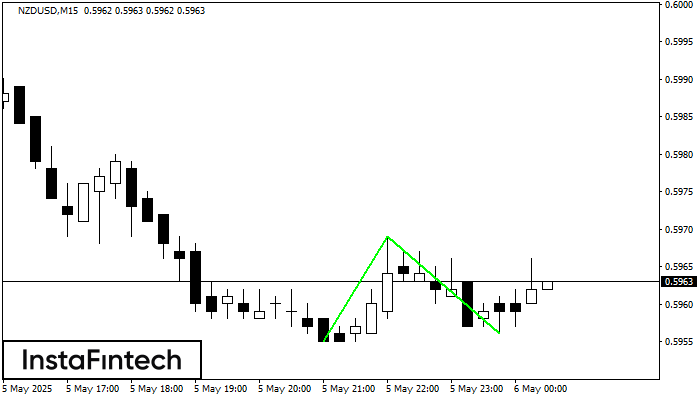
The Double Bottom pattern has been formed on NZDUSD M15. Characteristics: the support level 0.5955; the resistance level 0.5969; the width of the pattern 14 points. If the resistance level
The M5 and M15 time frames may have more false entry points.
Open chart in a new window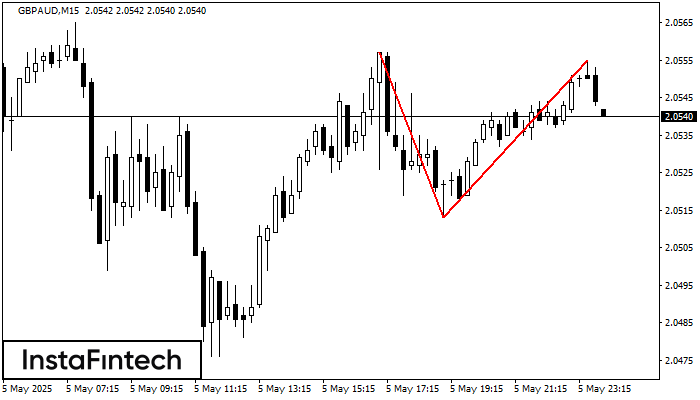
On the chart of GBPAUD M15 the Double Top reversal pattern has been formed. Characteristics: the upper boundary 2.0555; the lower boundary 2.0513; the width of the pattern 42 points
The M5 and M15 time frames may have more false entry points.
Open chart in a new window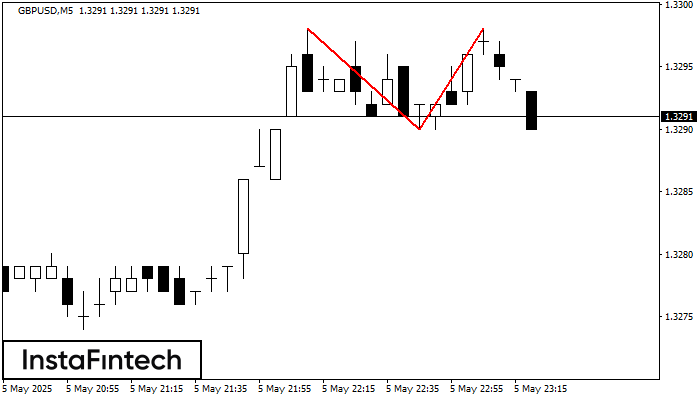
The Double Top reversal pattern has been formed on GBPUSD M5. Characteristics: the upper boundary 1.3298; the lower boundary 1.3290; the width of the pattern is 8 points. Sell trades
The M5 and M15 time frames may have more false entry points.
Open chart in a new window


