empty
06.05.2021 12:03 PM
Bitcoin forecast for May 6, 2021

This image is no longer relevant

1. How to make money on cryptocurrencies?

2. Volume analysis of BTC from the Chicago Mercantile Exchange (CME).

3. Trend analysis

4. Japanese candlestick analysis

5. Conclusion. Statistics

1. How to make money on cryptocurrencies?

If you want to make money on cryptocurrencies, you should refrain from using aggressive trading approaches, especially if you are a beginner. The best thing to do would be to apply a traditional method. Let us take a look at aggressive money management approaches that should only be used by experienced traders.

Locking is an aggressive money management strategy. According to this approach, a trader does not close a losing trade but opens a new one in the opposite direction. Thus, the position is locked, and a buy and a sell trade are open at the same time. A lock is several positions open for one instrument in different directions.

This image is no longer relevant

On the chart above, there is an example of how a lock is used. We open a long position, hoping that the bull trend extends, but do not place a Stop Loss. When the trend reverses, we open a short position, thus minimizing losses.

Any lock, if held for a long time, will be cancelled by a commission. If a position is held overnight, a commission will be charged, which means that losses will expand, albeit at a much slower rate. That is why there is no need to hold locks for a long time.

Thus, locking is an aggressive and complex money management strategy. It should only be used by professional traders.

2. Volume analysis of BTC from the Chicago Mercantile Exchange (CME)

Bitcoin is still moving sideways. Let us consider the levels of the highest traded volume from the Chicago Mercantile Exchange (CME). These levels indicate bull activity.

04.05.21 – the level of the highest traded volume (POC – PointOfControl) – 55,730

05.05.21 – the level of the highest traded volume (POC – PointOfControl) – 57,315

The POC has moved up. The price is below the POC. The market is in the sideways trend. Both long and short positions can be considered based on volume analysis.

3. Trend analysis

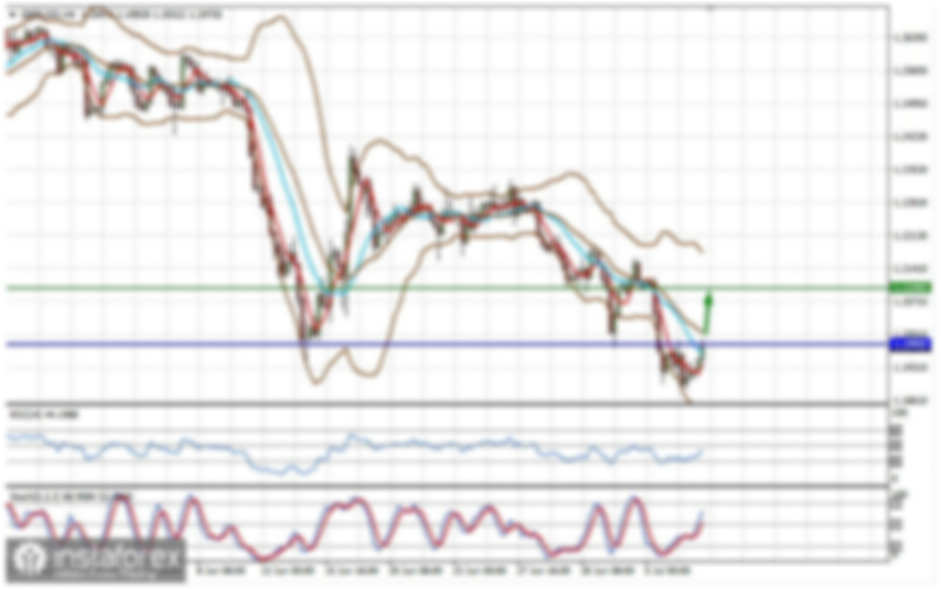
Our second step is to check the short-term, the mid-term, and the long-term trends. You can enter the market when all three trends are in line. In this forecast, trends are analyzed with the help of an exponential moving average:

Long-term trend – a blue EMA 1152 on the H1 chart, which is an alternative to EMA 48 on the D1 chart;

Mid-term trend – a red EMA 288 on the H1 chart, which is an alternative to EMA 48 on the H4 chart;

Short-term trend – a black EMA 48 on the H1 chart.

This image is no longer relevant

EMAs start heading up, indicating the possibility of the upward trend. That is why you should enter long positions according to trend analysis.

4. Japanese candlestick analysis

Japanese candlestick analysis is the third step of this trading strategy. Let us analyze yesterday's daily candlestick:

This image is no longer relevant

The white daily candlestick has closed upward. Extreme points are outside the previous candlestick. It is the Absorption candlestick pattern. Yesterday's candlestick is bigger that the prevoius day's one. Based on Japanese candlestick analysis, you should consider entering long positions today.

5. Conclusion. Statistics

  1. Volume analysis – BUY/SELL
  2. Long-term trend – BUY
  3. Medium-term trend – BUY
  4. Short-term trend – BUY
  5. Japanese candlestick analysis – BUY

Conclusion: You can both buy and sell BTC on May 6, since various analyses provide different forecasts.

Only statistics can reveal how efficient a trading strategy is. In this forecast, trades are carried out in a separate account. Trades are conducted in four instruments: Bitcoin, Ethereum, Litecoin, and BCH/USD. 3-months gains: 12.1%. Drawdown: 4.88%. Statement:

This image is no longer relevant

I do not open new trades due to market uncertainty.

The risk per trade is no more than 1%. A Stop Loss is placed beyond the high/low of the day, depending on the direction of the trade. A Take Profit is not set. A Stop Loss is moved beyond the extreme points of the upcoming sessions.

Since trading is carried out on daily charts, this recommendation is relevant throughout the day.

Trade with the trend and you will generate profits!

เลือกช่วงเวลา
5
นาที
15
นาที
30
นาที
1
ชั่วโมง
4
ชั่วโมง
1
วัน
1
สัปดาห์
รับผลกำไรจากการเปลี่ยนแปลงอัตราสกุลเงินดิจิทัลกับ InstaForex.
ดาวน์โหลด MetaTrader 4 และเปิดการซื้อขายครั้งแรกของคุณ.
  • Grand Choice
    Contest by
    InstaForex
    InstaForex always strives to help you
    fulfill your biggest dreams.
    เข้าร่วมการแข่งขัน


บทความแนะนำ

แรงกดดันกลับมาอีกครั้งต่อ Bitcoin และ Ethereum

หลังจากที่ทรัมป์ขึ้นกล่าวสุนทรพจน์ที่การประชุมสุดยอดเกี่ยวกับคริปโตเมื่อวานนี้ ความกดดันต่อ Bitcoin และ Ethereum ก็ได้กลับมาอีกครั้ง อีกปัจจัยหนึ่งที่ส่งผลกระทบคือการขายสินทรัพย์เสี่ยงในตลาดหุ้นสหรัฐฯ อย่างต่อเนื่อง เมื่อเร็วๆ นี้ ตลาดคริปโตมีความสัมพันธ์ใกล้ชิดกับตลาดหุ้นเป็นอย่างมาก ซึ่งชี้ให้เห็นถึงการพึ่งพาการพัฒนาทางเศรษฐกิจของสหรัฐฯ อย่างมากยิ่งขึ้น ผู้เข้าร่วมตลาดไม่ได้รับการสนับสนุนในระดับที่คาดการณ์ไว้จากการให้ความเห็นของ Trump

Jakub Novak 10:22 2025-03-21 UTC+2

คำแนะนำการซื้อขายสำหรับตลาดคริปโตเคอร์เรนซีในวันที่ 21 มีนาคม

Bitcoin และ Ethereum อีกครั้งที่พยายามต่อสู้เพื่อเอาชนะระดับแนวต้านสำคัญ ซึ่งทำให้เกิดความล่าช้าในแนวโน้มขาขึ้นระยะสั้นของสินทรัพย์เหล่านี้ ความไม่สามารถที่จะยืนอยู่ใกล้ระดับสูงสุดในรอบสัปดาห์ยังสะท้อนถึงความท้าทายที่ผู้ซื้อสินทรัพย์เสี่ยงต้องเผชิญในสภาพแวดล้อมตลาดปัจจุบัน หลังจากที่ราคาของ Bitcoin ลดลงไปต่ำสุดที่ประมาณ $83,770 ตอนนี้มันกำลังซื้อขายใกล้ๆ $84,100 ส่วน Ethereum หลังจากที่ลงไปที่

Miroslaw Bawulski 08:16 2025-03-21 UTC+2

การวิเคราะห์ทางเทคนิคของการเคลื่อนไหวของราคาบิตคอยน์ (Bitcoin) ในระหว่างวัน, วันศุกร์ที่ 21 มีนาคม 2025

ด้วยการเกิด Divergence ระหว่างการเคลื่อนไหวของราคาบิตคอยน์กับตัวบ่งชี้ Stochastic Oscillator และรูปแบบ Bullish 123 ตามด้วย Bullish Ross Hook (RH)) ในอนาคตอันใกล้นี้บิตคอยน์อาจมีโอกาสทดสอบระดับ 86611.34

Arief Makmur 06:18 2025-03-21 UTC+2

การวิเคราะห์ทางเทคนิคของการเคลื่อนไหวราคาภายในวันของคริปโตเคอร์เรนซี Ripple ประจำวันศุกร์ที่ 21 มีนาคม 2025

หากเราพิจารณาชาร์ต 4 ชั่วโมงของคริปโตเคอร์เรนซี Ripple จะพบว่ามีการเกิด Divergence ระหว่างการเคลื่อนไหวของราคา Ripple กับตัวชี้วัด Stochastic Oscillator และการปรากฏของรูปแบบ Bullish 123 ตามด้วย

Arief Makmur 06:18 2025-03-21 UTC+2

บิทคอยน์ตั้งเป้าหมายแตะ $90,000

หลังการประชุมของ Federal Reserve เมื่อวานนี้ ซึ่งธนาคารกลางไม่มีข้อโต้แย้งที่รุนแรงในการคงอัตราดอกเบี้ยให้สูงอีกต่อไป Bitcoin และ Ethereum ได้กลับมาเคลื่อนไหวในทิศทางขาขึ้น แม้ว่าทาง Fed จะยืนยันถึงการใช้นโยบายการเงินที่เข้มงวดเนื่องจากเงินเฟ้อ แต่การชะลอตัวของเศรษฐกิจที่คาดการณ์ไว้ในที่สุดจะบังคับให้มีการเปลี่ยนแปลงนโยบาย ตลาดคริปโตปรับตัวทันที โดยพุ่งสูงขึ้นเพื่อตอบสนอง

Jakub Novak 09:32 2025-03-20 UTC+2

คำแนะนำการซื้อขายสำหรับตลาดสกุลเงินดิจิทัลในวันที่ 20 มีนาคม

Bitcoin และ Ethereum ปรับตัวขึ้นหลังจากการประชุมของ Federal Reserve เมื่อวานนี้ ซึ่งระบุว่าอัตราดอกเบี้ยอาจจำเป็นต้องลดลง ไม่ว่า Fed จะตั้งใจรักษานโยบายการเงินที่เคร่งครัดไว้นานแค่ไหน แต่การเติบโตทางเศรษฐกิจที่ชะลอตัวจะบังคับให้คณะกรรมการต้องดำเนินการในที่สุด ความคาดหวังนี้ได้ผลักดันให้ตลาดคริปโตเคอเรนซีปรับตัวขึ้น หลังจากที่ราคาร่วงลงต่ำสุดที่ประมาณ $83,500

Miroslaw Bawulski 08:22 2025-03-20 UTC+2

Bitcoin ตั้งเป้า $85,000

ความสนใจใน Bitcoin ยังคงแข็งแกร่ง เนื่องจากการเคลื่อนไหวทางลงตามปกติใด ๆ จะถูกซื้อต่อโดยผู้เล่นรายใหญ่ในทันที ข้อเท็จจริงที่ว่า ETFs ของ Bitcoin แบบสปอตในสหรัฐฯ กลับมาบันทึกการไหลเข้าของเงินสุทธิอีกครั้งก็ส่งสัญญาณถึงความเต็มใจของนักลงทุนที่จะซื้ออีกครั้งในราคาที่ดึงดูดใจ ตามข้อมูลล่าสุด ในช่วงไม่กี่วันที่ผ่านมา Bitcoin

Jakub Novak 10:49 2025-03-19 UTC+2

คำแนะนำในการซื้อขายสำหรับตลาดคริปโตเคอร์เรนซีวันที่ 19 มีนาคม

Bitcoin และ Ethereum เผชิญกับความท้าทายอีกครั้งหลังจากการเทขายในตลาดหุ้นสหรัฐที่เกิดขึ้นเมื่อเร็ว ๆ นี้ แต่ผู้ซื้อและผู้เล่นรายใหญ่ก็ได้แสดงถึงพลังของพวกเขาอีกครั้งด้วยการซื้อทั้งหมดในขณะที่เครื่องมือการค้ากำลังปรับตัวลง หลังจากที่ราคาบิทคอยน์ขึ้นไปแตะระดับสูงสุดที่ประมาณ $81,200 ขณะนี้กำลังซื้อขายที่ $83,100 ส่วนอีเธอเรียม หลังจากราคาขึ้นไปแตะที่ $1,872 ก็ฟื้นตัวอย่างรวดเร็วเป็นประมาณ

Miroslaw Bawulski 09:01 2025-03-19 UTC+2

การวิเคราะห์ BTC/USD – วันที่ 18 มีนาคม: Bitcoin เตรียมตัวเติบโต แต่ความเสี่ยงในการล่มสลายยังคงอยู่

โครงสร้างคลื่นในช่วง 4 ชั่วโมงสำหรับ BTC/USD ดูชัดเจนและมีการกำหนดอย่างดี หลังจากสิ้นสุดแนวโน้มขาขึ้นแบบห้าคลื่น ก็เริ่มช่วงขาลงซึ่งขณะนี้ดูเป็นรูปแบบแก้ไข จากนี้ ทำให้ผมไม่คาดว่า Bitcoin จะเกิน $110,000 - $115,000 ในช่วงหลายเดือนข้างหน้า

Chin Zhao 09:47 2025-03-18 UTC+2

คำแนะนำการซื้อขายสำหรับตลาดคริปโตเคอร์เรนซี วันที่ 18 มีนาคม

ผู้ซื้อ Bitcoin และ Ethereum พยายามสร้างการเติบโตให้มากขึ้น และในช่วงหนึ่ง ตลาดขาขึ้นอาจมีความหวังที่จะกลับมาได้ อย่างไรก็ตาม พวกเขาไม่สามารถยึดจุดสูงที่เคยทำได้ ทำให้เกิดการปรับฐานลงอย่างมีนัยสำคัญในเครื่องมือการซื้อขายเหล่านี้ ซึ่งยังคงเคลื่อนที่อยู่ในช่องทางด้านข้าง หลังจากที่สูงสุดใหม่ประมาน $84,600 Bitcoin กำลังซื้อขายอยู่ที่

Miroslaw Bawulski 08:00 2025-03-18 UTC+2
หากไม่สะดวกคุยในตอนนี้
ระบุคำถามไว้ได้ใน แชท.
Widget callback
 

Dear visitor,

Your IP address shows that you are currently located in the USA. If you are a resident of the United States, you are prohibited from using the services of InstaFintech Group including online trading, online transfers, deposit/withdrawal of funds, etc.

If you think you are seeing this message by mistake and your location is not the US, kindly proceed to the website. Otherwise, you must leave the website in order to comply with government restrictions.

Why does your IP address show your location as the USA?

  • - you are using a VPN provided by a hosting company based in the United States;
  • - your IP does not have proper WHOIS records;
  • - an error occurred in the WHOIS geolocation database.

Please confirm whether you are a US resident or not by clicking the relevant button below. If you choose the wrong option, being a US resident, you will not be able to open an account with InstaForex anyway.

We are sorry for any inconvenience caused by this message.