Dolzarb patternlar
Паттерны – это графические модели, которые "рисует" цена на графике. Один из постулатов технического анализа говорит нам о том, что история (движение цены) всегда повторяется. Это значит, что в похожих ситуациях движение цены, зачастую, будет похожим, что позволяет с высокой долей вероятности спрогнозировать дальнейшее развитие ситуации.
Актуальные паттерны
- Все
- Вымпел
- Голова и плечи
- Двойная вершина
- Прямоугольник
- Треугольник
- Тройная вершина
- Флаг
- Все
- #AAPL
- #AMZN
- #Bitcoin
- #EBAY
- #FB
- #GOOG
- #INTC
- #KO
- #MA
- #MCD
- #MSFT
- #NTDOY
- #PEP
- #TSLA
- #TWTR
- AUDCAD
- AUDCHF
- AUDJPY
- AUDUSD
- EURCAD
- EURCHF
- EURGBP
- EURJPY
- EURNZD
- EURRUB
- EURUSD
- GBPAUD
- GBPCHF
- GBPJPY
- GBPUSD
- GOLD
- NZDCAD
- NZDCHF
- NZDJPY
- NZDUSD
- SILVER
- USDCAD
- USDCHF
- USDJPY
- USDRUB
- Все
- M5
- M15
- M30
- H1
- D1
- Все
- Покупка
- Продажа
- Все
- 1
- 2
- 3
- 4
- 5
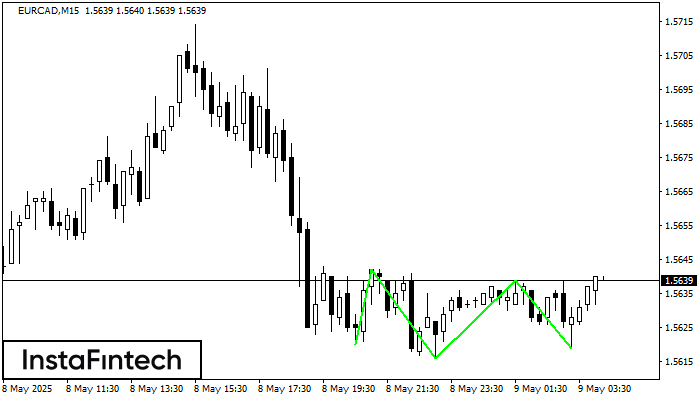
The Triple Bottom pattern has formed on the chart of EURCAD M15. Features of the pattern: The lower line of the pattern has coordinates 1.5642 with the upper limit 1.5642/1.5639
The M5 and M15 time frames may have more false entry points.
Открыть график инструмента в новом окне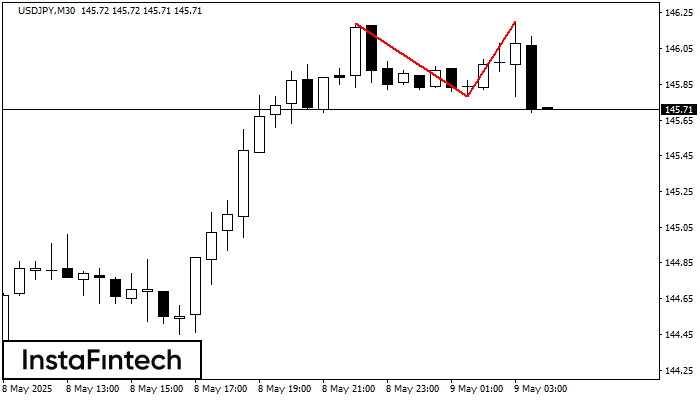
The Double Top pattern has been formed on USDJPY M30. It signals that the trend has been changed from upwards to downwards. Probably, if the base of the pattern 145.78
Открыть график инструмента в новом окне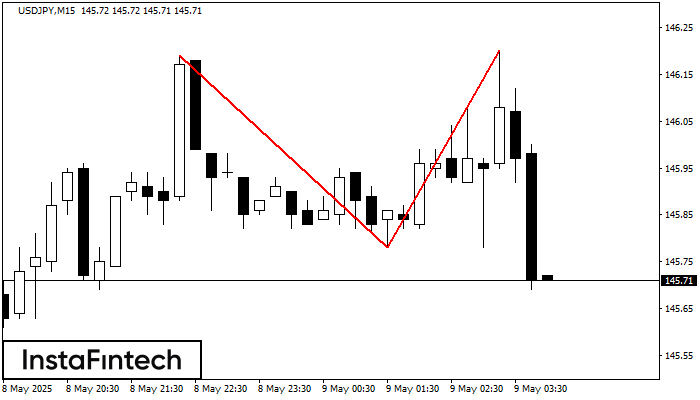
The Double Top pattern has been formed on USDJPY M15. It signals that the trend has been changed from upwards to downwards. Probably, if the base of the pattern 145.78
The M5 and M15 time frames may have more false entry points.
Открыть график инструмента в новом окне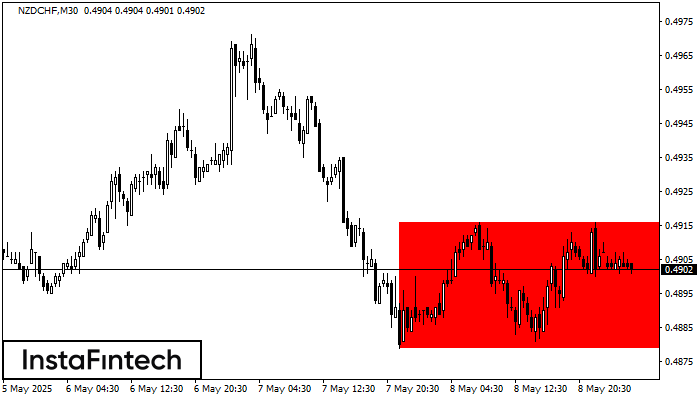
According to the chart of M30, NZDCHF formed the Bearish Rectangle. The pattern indicates a trend continuation. The upper border is 0.4916, the lower border is 0.4879. The signal means
Открыть график инструмента в новом окне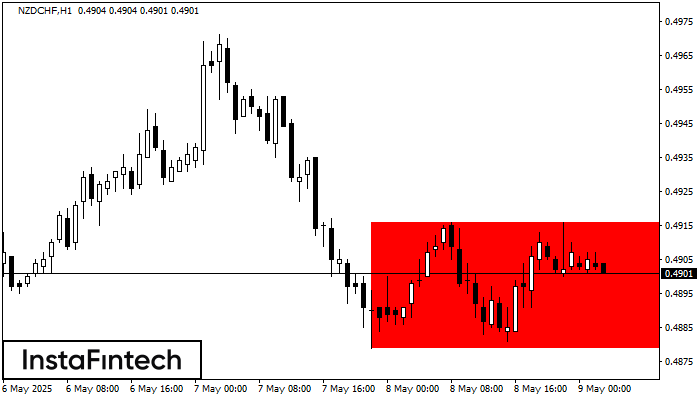
According to the chart of H1, NZDCHF formed the Bearish Rectangle. The pattern indicates a trend continuation. The upper border is 0.4916, the lower border is 0.4879. The signal means
Открыть график инструмента в новом окне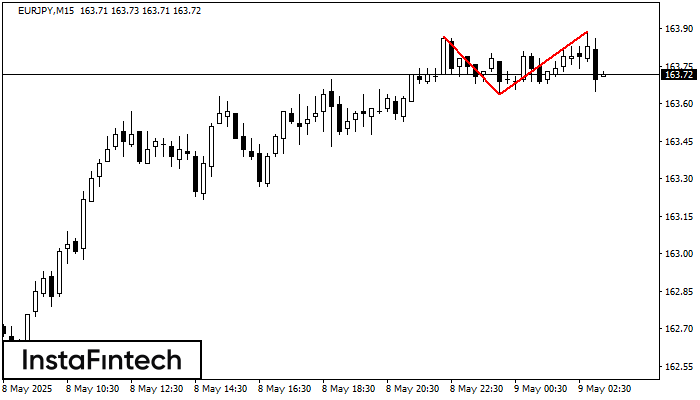
On the chart of EURJPY M15 the Double Top reversal pattern has been formed. Characteristics: the upper boundary 163.89; the lower boundary 163.64; the width of the pattern 25 points
The M5 and M15 time frames may have more false entry points.
Открыть график инструмента в новом окне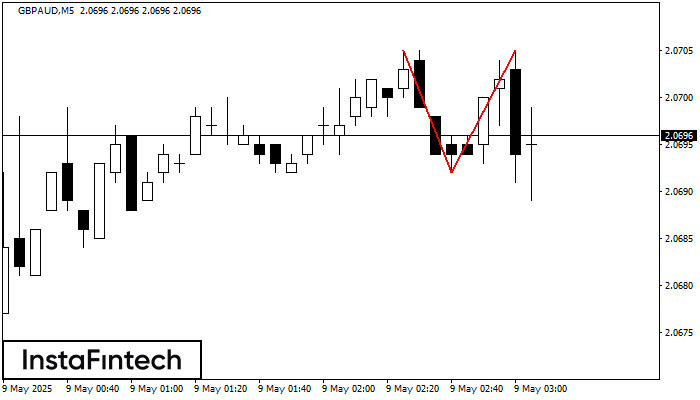
On the chart of GBPAUD M5 the Double Top reversal pattern has been formed. Characteristics: the upper boundary 2.0705; the lower boundary 2.0692; the width of the pattern 13 points
The M5 and M15 time frames may have more false entry points.
Открыть график инструмента в новом окне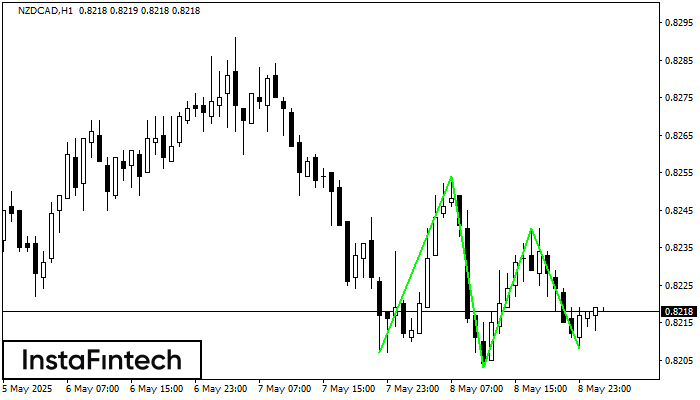
The Triple Bottom pattern has formed on the chart of NZDCAD H1. Features of the pattern: The lower line of the pattern has coordinates 0.8254 with the upper limit 0.8254/0.8240
Открыть график инструмента в новом окне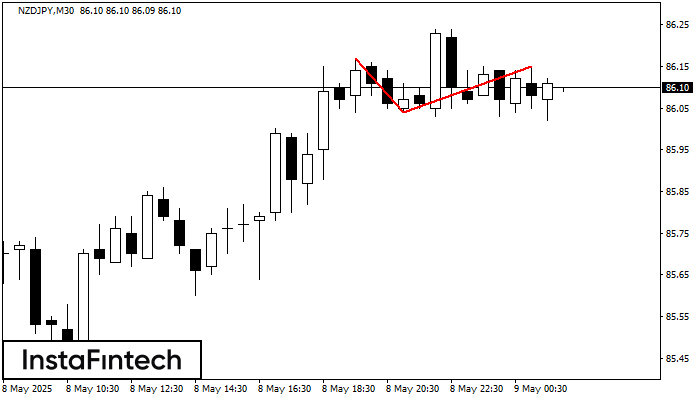
The Double Top reversal pattern has been formed on NZDJPY M30. Characteristics: the upper boundary 86.17; the lower boundary 86.04; the width of the pattern is 11 points. Sell trades
Открыть график инструмента в новом окне